

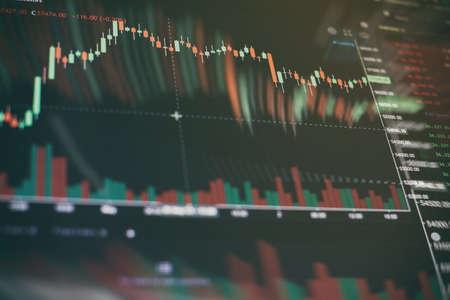
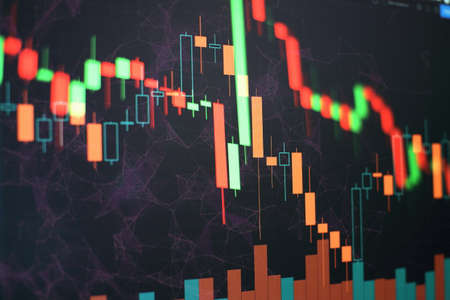
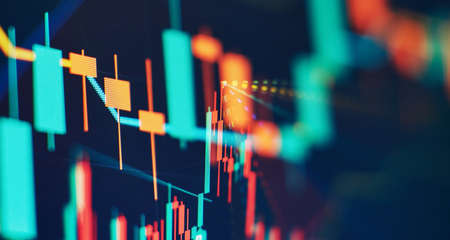
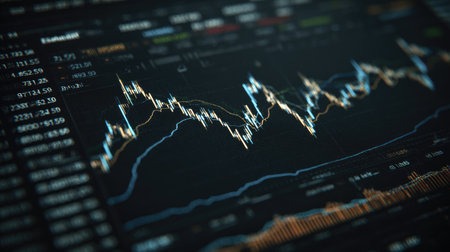
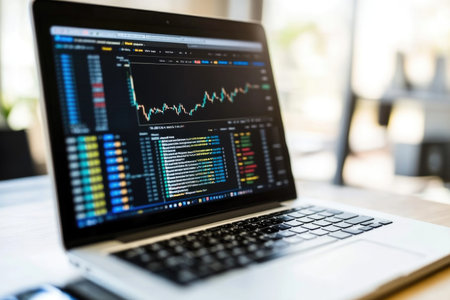
Shallow depth of field (selective focus) with details of a chart showing the stock market crash from March 2020 due to the Covid-19 pandemic on a computer screen (S&P500 index)
Коллекция по умолчанию
Коллекция по умолчанию
Создать новую

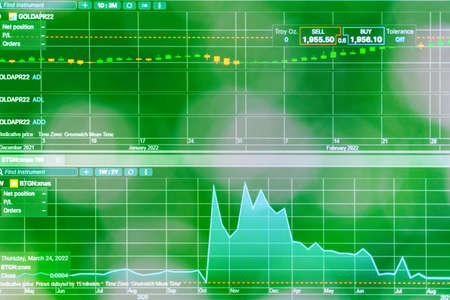
Blockchain schematic on printout on desk or boardroom table showing encrypted blocks of ledger
Коллекция по умолчанию
Коллекция по умолчанию
Создать новую

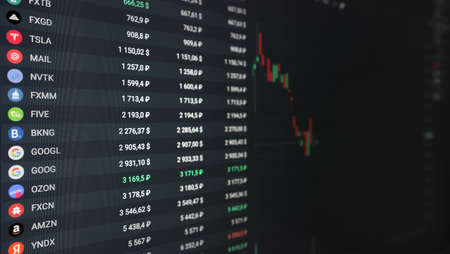
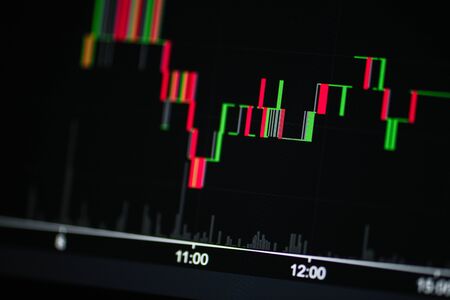
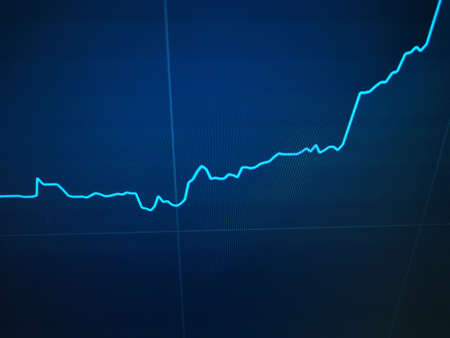
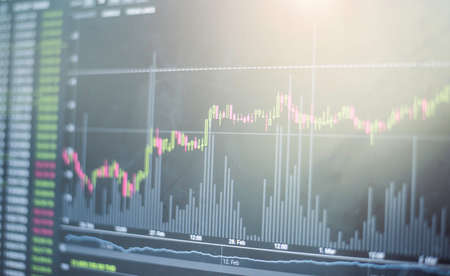
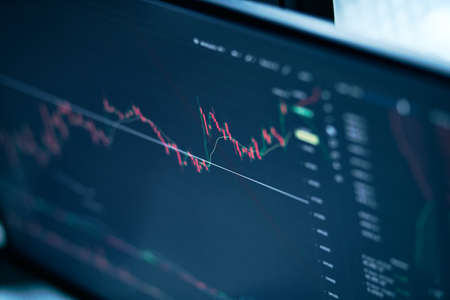
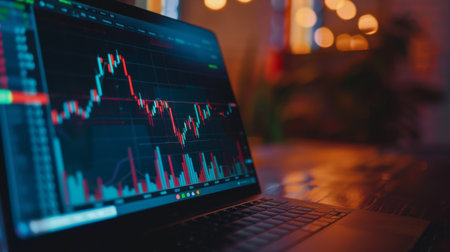
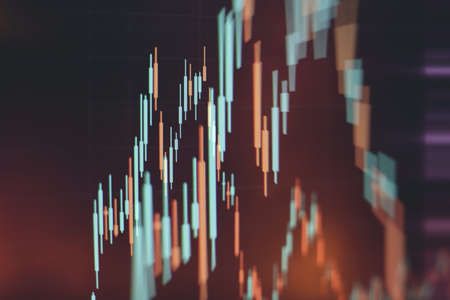
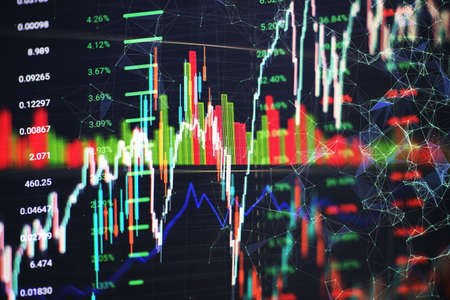
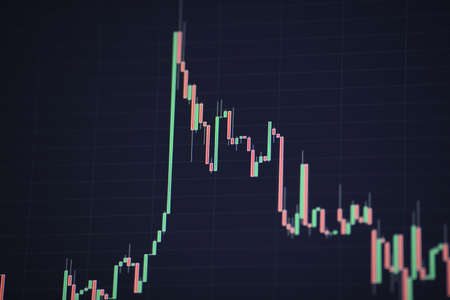
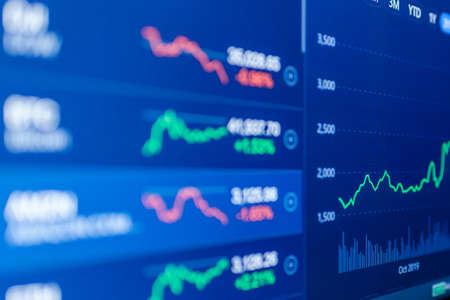
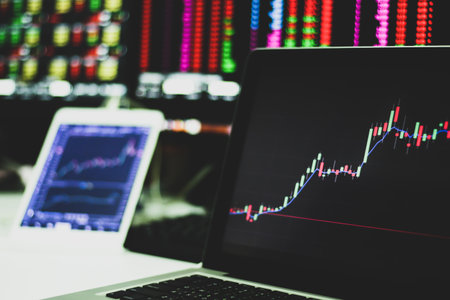
Financial stock market graph. Stock Exchange. Selective focus.
Коллекция по умолчанию
Коллекция по умолчанию
Создать новую

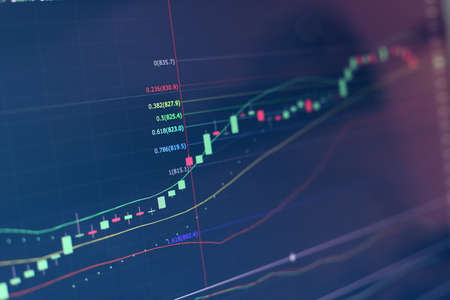
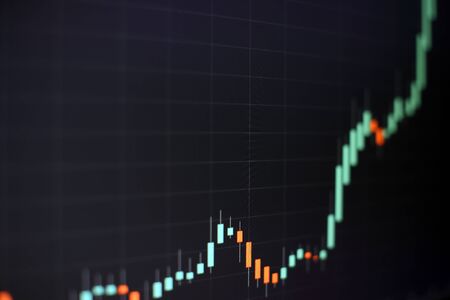
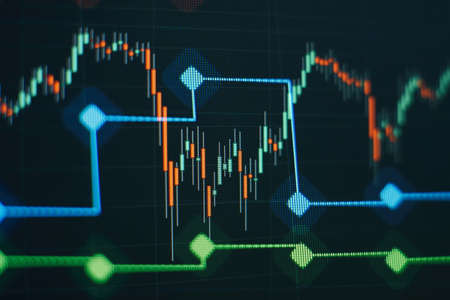
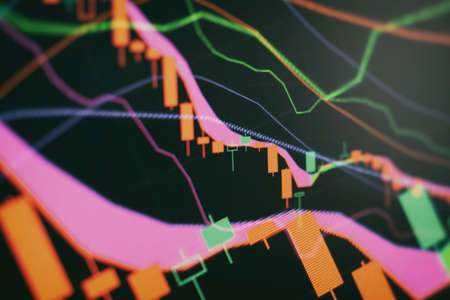
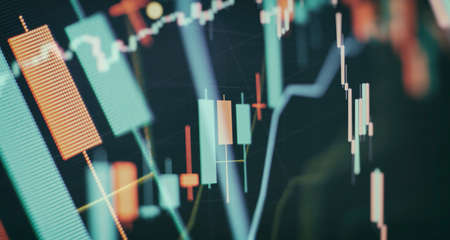
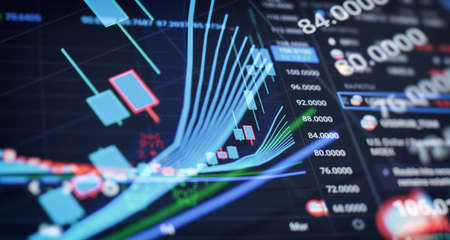
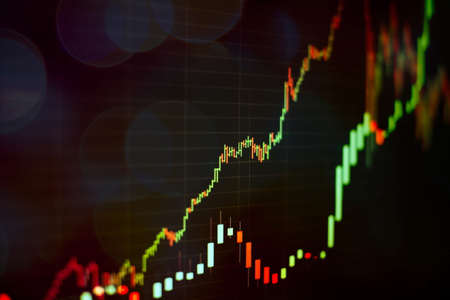
Financial instruments with various types of indicators including volume analysis for professional technical analysis
Коллекция по умолчанию
Коллекция по умолчанию
Создать новую

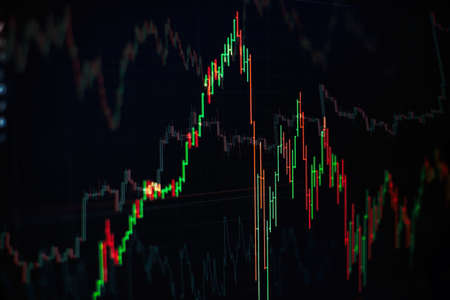
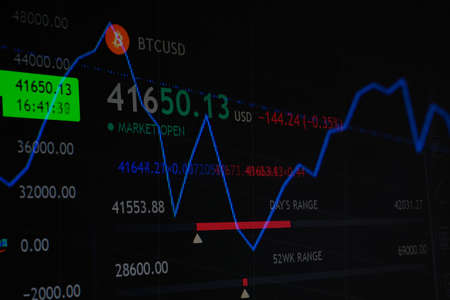
Business financial or stock market background. Business graph on stock market financial exchange
Коллекция по умолчанию
Коллекция по умолчанию
Создать новую

image of the financial graph on a computer monitor.
Коллекция по умолчанию
Коллекция по умолчанию
Создать новую
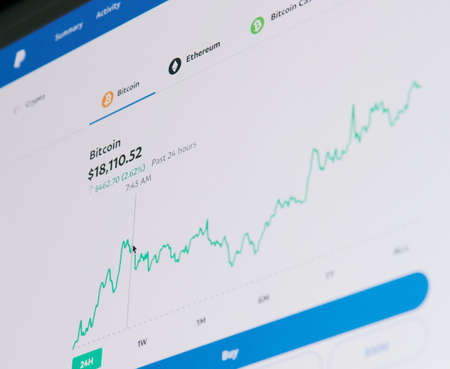
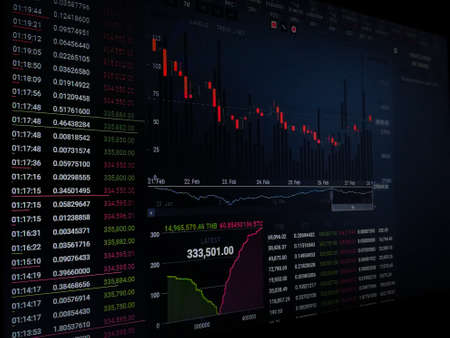
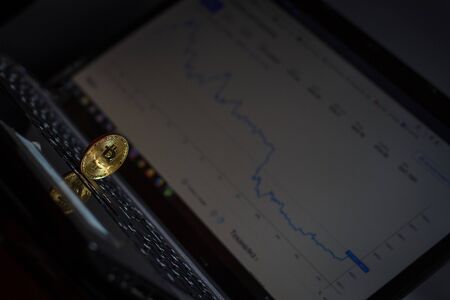
New york, USA - November 20, 2020: Buying bitcoin via paypal service on screen laptop close up view
Коллекция по умолчанию
Коллекция по умолчанию
Создать новую

financial graph on monitor for business and finance concept. shallow depth of field
Коллекция по умолчанию
Коллекция по умолчанию
Создать новую
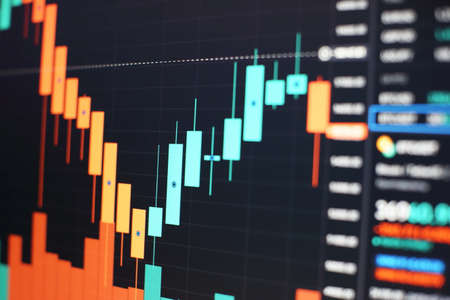
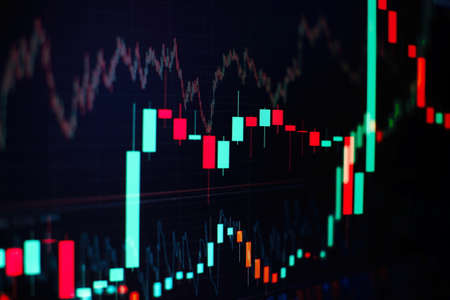
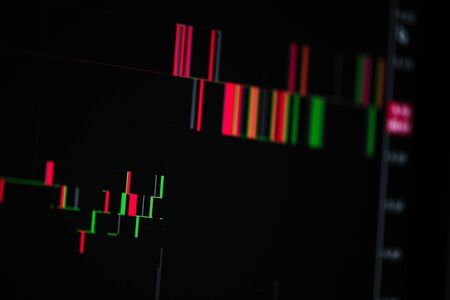
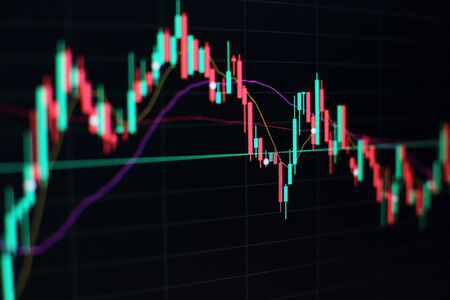
Stock exchange market chart background. Candle stick graph chart with indicator.
Коллекция по умолчанию
Коллекция по умолчанию
Создать новую
Laptop screen with stock market charts. Technical analysis and fundamental indicators of stock quotes in the trading terminal. Japanese candlesticks and company tickers.
Коллекция по умолчанию
Коллекция по умолчанию
Создать новую

A detailed close-up view of a candlestick chart displaying stock data. The graphic illustrates financial trends with vibrant colors, aiding data analysis.
Коллекция по умолчанию
Коллекция по умолчанию
Создать новую
Stock exchange, cryptocurrency price chart on a screen. Candlestick chart, btc. Online currency exchange market. Trading, bidding. Tracking the cryptocurrency rate. 4K. Close up.
Коллекция по умолчанию
Коллекция по умолчанию
Создать новую
Sustainable portfolio management, long term wealth management with risk diversification concept.
Коллекция по умолчанию
Коллекция по умолчанию
Создать новую

Data analyzing in Forex, Commodities, Equities, Fixed Income and Emerging Markets: the charts and summary info show about Business statistics and Analytics value - Wealth management concept.
Коллекция по умолчанию
Коллекция по умолчанию
Создать новую

Fundamental and technical analysis concept.
Коллекция по умолчанию
Коллекция по умолчанию
Создать новую

indicators including volume analysis for professional technical analysis on the monitor of a computer. Fundamental and technical analysis concept.
Коллекция по умолчанию
Коллекция по умолчанию
Создать новую
Stock graph on computer on black background.
Коллекция по умолчанию
Коллекция по умолчанию
Создать новую
Stockmarket diagram and grah on displayscreen
Коллекция по умолчанию
Коллекция по умолчанию
Создать новую
View of Stock Market Crash from Covid-19 Pandemic with shallow depth of field.
Коллекция по умолчанию
Коллекция по умолчанию
Создать новую
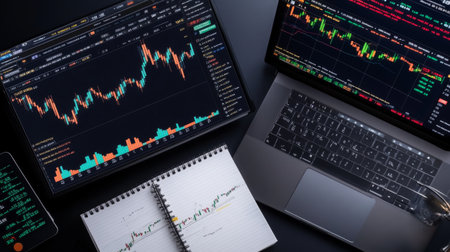
Working set for analyzing financial statistics and analyzing a market data. Data analyzing from charts and graph to find out the result.
Коллекция по умолчанию
Коллекция по умолчанию
Создать новую
Daily trading prices stock market graph showing on the screen.Daily investor's business everyday life.Selective focus.Telsiai,Lithuania.03-26-2022
Коллекция по умолчанию
Коллекция по умолчанию
Создать новую

Business and Economy Theme. Trading Cryptocurrencies. Stock Market Candles Chart on Computer Display Close Up.
Коллекция по умолчанию
Коллекция по умолчанию
Создать новую

Abstract candlestick chart on white digital screen. Stock market or crypto data chart, graph with rectangular grid on light background.
Коллекция по умолчанию
Коллекция по умолчанию
Создать новую

Financial stock market graph. Stock Exchange. Selective focus.
Коллекция по умолчанию
Коллекция по умолчанию
Создать новую

Online stock exchange application with information on screen, closeup
Коллекция по умолчанию
Коллекция по умолчанию
Создать новую

The business plan at the meeting and analyze financial numbers to view the performance of the company.
Коллекция по умолчанию
Коллекция по умолчанию
Создать новую

Analyzing financial statistics and analyzing a market data. Data analysis from charts and graphs
Коллекция по умолчанию
Коллекция по умолчанию
Создать новую

Vibrant candlestick patterns and descending trend lines illustrate a market downturn, highlighting analysis tools amid a somber financial atmosphere.
Коллекция по умолчанию
Коллекция по умолчанию
Создать новую
Ufa, Russia November 11, 2021: Laptop screen with stock market charts. Technical analysis and fundamental indicators of stock quotes in the trading terminal. Japanese candlesticks and company tickers.
Коллекция по умолчанию
Коллекция по умолчанию
Создать новую
The Stock Exchange, Streaming Trade Screen, The stock screen Show the stock price rise.
Коллекция по умолчанию
Коллекция по умолчанию
Создать новую

Trader investor broker holding finger using cell phone app executing financial stock trade market trading order to buy or sell
Коллекция по умолчанию
Коллекция по умолчанию
Создать новую
Economic graph with diagrams on the stock market, for business and financial concepts and reports
Коллекция по умолчанию
Коллекция по умолчанию
Создать новую
Cryptocurrency stock market trading Stock analysis concept. BTC and ETH cryptocurrency stock trading.
Коллекция по умолчанию
Коллекция по умолчанию
Создать новую

graph of financial growth on a computer monitor.
Коллекция по умолчанию
Коллекция по умолчанию
Создать новую
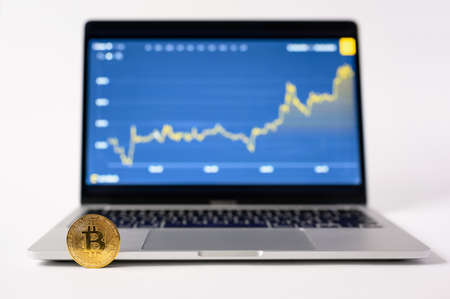
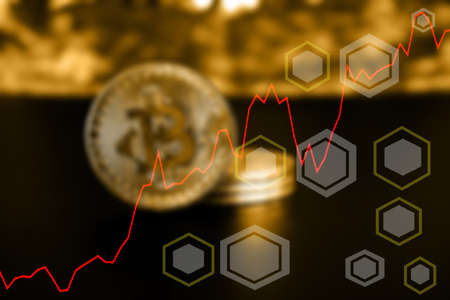
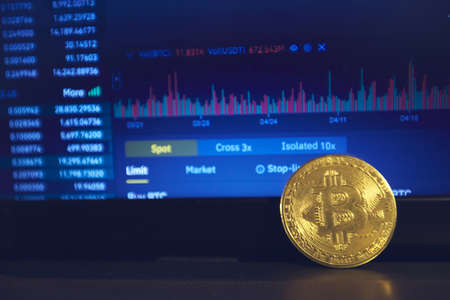
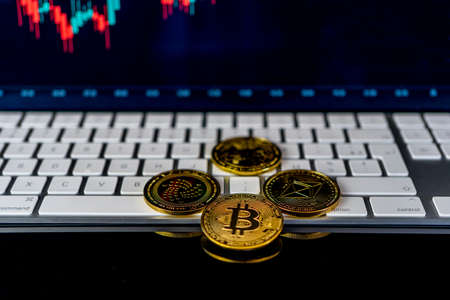
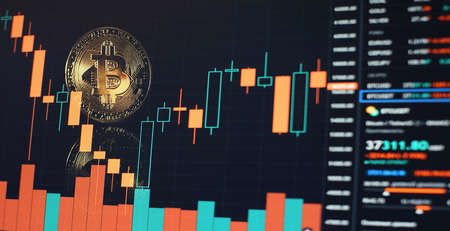
A gold bitcoin coin stands by a laptop against the background of a display with a growing graph
Коллекция по умолчанию
Коллекция по умолчанию
Создать новую
Financial chart with pen, stock analysis data for business background on digital screen. Graphs of the growth of the financial market forex. trading candlestick chart
Коллекция по умолчанию
Коллекция по умолчанию
Создать новую
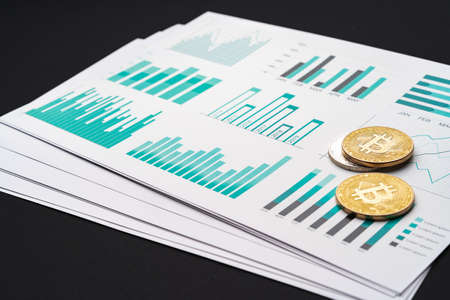
Bitcoin coin on stock market charts papers
Коллекция по умолчанию
Коллекция по умолчанию
Создать новую
Stock market graph on screen. Ticker on monitor screen. Investing, Finance and Economic concept. Shallow depth of field.
Коллекция по умолчанию
Коллекция по умолчанию
Создать новую
Analysis business accounting on info sheets. Businessman hand working on analyzing investment charts for Gold market, Forex market and Trading market.
Коллекция по умолчанию
Коллекция по умолчанию
Создать новую

Shallow depth of field (selective focus) with details of a candlestick chart on a computer screen.
Коллекция по умолчанию
Коллекция по умолчанию
Создать новую

Financial stock market graph. Stock Exchange. Selective focus.
Коллекция по умолчанию
Коллекция по умолчанию
Создать новую
Economic graph with diagrams on the stock market, for business and financial concepts and reports.
Коллекция по умолчанию
Коллекция по умолчанию
Создать новую
The dynamics of changes in currencies. Price growth chart and economic recovery
Коллекция по умолчанию
Коллекция по умолчанию
Создать новую
Abstract virtual coding illustration on Chicago cityscape background, software development concept. Multi-exposure
Коллекция по умолчанию
Коллекция по умолчанию
Создать новую
market analyze. Bar graphs, Diagrams, financial figures. Abstract glowing forex chart interface wallpaper. Investment, trade, stock, finance
Коллекция по умолчанию
Коллекция по умолчанию
Создать новую
Stock Market Trading Chart Investment Analysis Business Index Chart Finance Board Chart
Коллекция по умолчанию
Коллекция по умолчанию
Создать новую
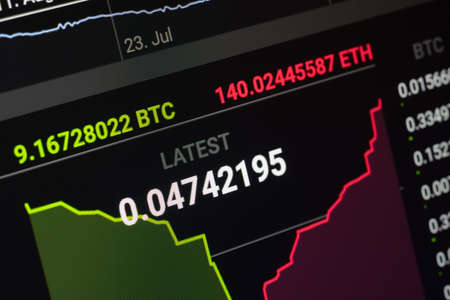
Thailand - March 02, 2018: Cryptocurrency exchange rate on monitor display. Cryptocurrency invest chart.
Коллекция по умолчанию
Коллекция по умолчанию
Создать новую

Indicators including volume analysis for professional technical analysis on the monitor of a computer. Fundamental and technical analysis concept.
Коллекция по умолчанию
Коллекция по умолчанию
Создать новую

Sales profit numbers changing on monitor after global trade, real time exchange market stocks statistics growing. Financial graphs showing money trend, risk buying. Close up. Tripod shot.
Коллекция по умолчанию
Коллекция по умолчанию
Создать новую

Stock market or forex trading graph in graphic concept suitable for financial investment or Economic trends business idea and all art work design.
Коллекция по умолчанию
Коллекция по умолчанию
Создать новую

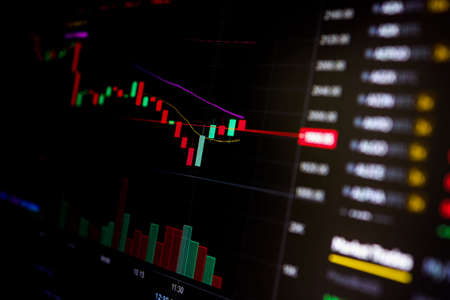
Stockmarket online trading chart candlestick on crypto currency platform. Stock exchange financial market price candles graph data pattern analysis concept. Computer screen closeup background
Коллекция по умолчанию
Коллекция по умолчанию
Создать новую

Business success and growth concept. Stock market business graph chart on digital screen. Forex market, Gold market and Crude oil market.
Коллекция по умолчанию
Коллекция по умолчанию
Создать новую

Stock market candlestick chart, asset prices movement, currency exchange price action simple concept. Computer screen, display, candle chart, graph detail, extreme closeup, nobody, no people
Коллекция по умолчанию
Коллекция по умолчанию
Создать новую
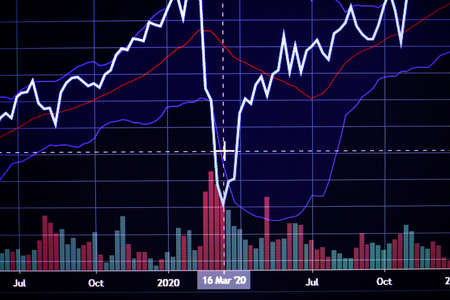
Shallow depth of field (selective focus) with details of a chart showing the stock market crash from March 2020 due to the Covid-19 pandemic on a computer screen (S&P500 index)
Коллекция по умолчанию
Коллекция по умолчанию
Создать новую
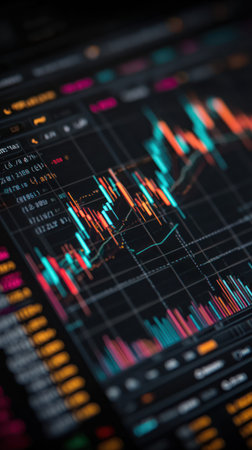
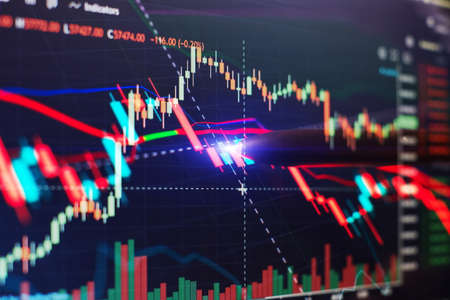
A close-up view presents a digital stock market chart with colorful data points and lines. The image displays complex financial information against a dark background, showcasing business and economic trends. This graphic can be used for presentations related to investment, trading, and market analysis.
Коллекция по умолчанию
Коллекция по умолчанию
Создать новую

The Stock Exchange, Streaming Trade Screen, The stock screen shows a list of stocks with reduced value.
Коллекция по умолчанию
Коллекция по умолчанию
Создать новую
Stock graph on computer on black background.
Коллекция по умолчанию
Коллекция по умолчанию
Создать новую
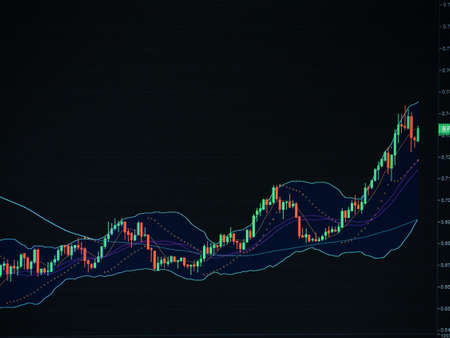
Technical price graph and indicator, red and green candlestick chart on blue theme screen, market volatility, up and down trend. Stock trading, cryptocurrencies background.
Коллекция по умолчанию
Коллекция по умолчанию
Создать новую
Volume analysis for professional technical analysis on the monitor of a computer. Fundamental and technical analysis concept.
Коллекция по умолчанию
Коллекция по умолчанию
Создать новую
Close-up view of a laptop displaying data analysis with charts and graphs, perfect for showcasing technology, finance, or business analytics themes.
Коллекция по умолчанию
Коллекция по умолчанию
Создать новую
graph of financial growth on a computer monitor. cryptocurrency.
Коллекция по умолчанию
Коллекция по умолчанию
Создать новую

Double exposure of blockchain and crypto economy theme hologram and table with computer background. Concept of bitcoin cryptocurrency.
Коллекция по умолчанию
Коллекция по умолчанию
Создать новую
The Forex graph chart on the digital screen. Working set for analyzing financial statistics and analyzing a market data.
Коллекция по умолчанию
Коллекция по умолчанию
Создать новую
Financial accounting of profit summary graphs analysis.
Коллекция по умолчанию
Коллекция по умолчанию
Создать новую
A close-up of a laptop screen displaying a stock market graph with fluctuating prices and trading volumes.
Коллекция по умолчанию
Коллекция по умолчанию
Создать новую
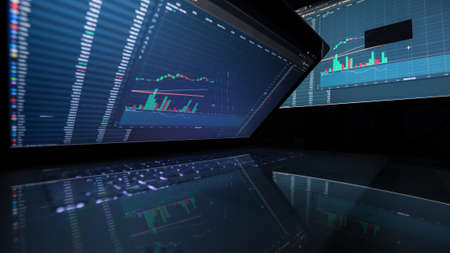
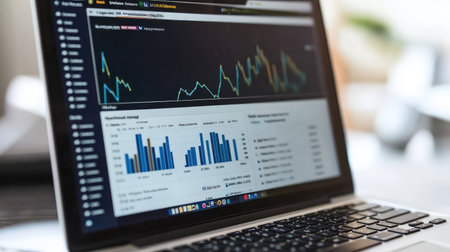
A modern workspace featuring multiple screens displaying financial charts and analytics, showcasing data analysis and investment strategies for business professionals.
Коллекция по умолчанию
Коллекция по умолчанию
Создать новую
Stock Market Trading Chart Investment Analysis Business Index Chart Finance Board Chart
Коллекция по умолчанию
Коллекция по умолчанию
Создать новую
This image features a close-up of a financial chart displaying various stock market indicators and candlestick patterns, providing insight into trading strategies.
Коллекция по умолчанию
Коллекция по умолчанию
Создать новую
Financial statistics, stock exchange prices summarized in candle stick chart.
Коллекция по умолчанию
Коллекция по умолчанию
Создать новую

Investment, trade, stock, finance and analysis , Economic graph with diagrams on the stock market, for business and financial concepts
Коллекция по умолчанию
Коллекция по умолчанию
Создать новую
Business success and growth concept. Stock market business graph chart on digital screen. Forex market, Gold market and Crude oil market.
Коллекция по умолчанию
Коллекция по умолчанию
Создать новую

Abstract glowing forex chart interface wallpaper. Investment, trade, stock, finance and analysis concept.
Коллекция по умолчанию
Коллекция по умолчанию
Создать новую
Bull market trend. Cryptocurrency. Bitcoin Stock Growth. Chart shows a strong increase in the price of bitcoin. Investing in virtual assets. Investment platform with charts
Коллекция по умолчанию
Коллекция по умолчанию
Создать новую

indicators including volume analysis for professional technical analysis on the monitor of a computer. Fundamental and technical analysis concept.
Коллекция по умолчанию
Коллекция по умолчанию
Создать новую
There is a gold bitcoin coin on the laptop panel, the page for changing cryptocurrency rates is open on the laptop display
Коллекция по умолчанию
Коллекция по умолчанию
Создать новую
Business success and growth concept. Stock market business graph chart on digital screen. Forex market, Gold market and Crude oil market.
Коллекция по умолчанию
Коллекция по умолчанию
Создать новую
Business or Financial Reference: Displaying stock market data, stock exchange or chart on a monitor, stock market chart, stock exchange or chart. stock market investment trading chart.
Коллекция по умолчанию
Коллекция по умолчанию
Создать новую
Generative AI : Hand reach out golden bitcoins cryptocurrency easy mining software earn real money from laptop screen Digital international network payment system block chain Inves
Коллекция по умолчанию
Коллекция по умолчанию
Создать новую
Analysis for professional technical analysis on the monitor of a computer. Fundamental and technical analysis concept.
Коллекция по умолчанию
Коллекция по умолчанию
Создать новую
Two gold bitcoins are on the charts of changes in cryptocurrency rates
Коллекция по умолчанию
Коллекция по умолчанию
Создать новую

Financial accounting of profit summary graphs analysis.
Коллекция по умолчанию
Коллекция по умолчанию
Создать новую
Dynamic digital interface illustrating stock market trends with red highlights and data analysis
Коллекция по умолчанию
Коллекция по умолчанию
Создать новую
Business graph. Bullish Bearish trend. Candlestick chart uptrend downtrend . Stock trade on online market forex.
Коллекция по умолчанию
Коллекция по умолчанию
Создать новую

MONTREAL, CANADA - JUNE 20, 2018: Zilliqa crypto currency home page. Cryptocurrency is a digital currency in which encryption techniques are used to generate and transfer funds. Site - zilliqa.com
Коллекция по умолчанию
Коллекция по умолчанию
Создать новую
Minimalist Financial Analysis on Laptop with Stock Market Charts.
Коллекция по умолчанию
Коллекция по умолчанию
Создать новую
The business plan at the meeting and analyze financial numbers to view the performance of the company.
Коллекция по умолчанию
Коллекция по умолчанию
Создать новую
Stock market graph on screen. Ticker on monitor screen. Investing, Finance and Economic concept. Shallow depth of field.
Коллекция по умолчанию
Коллекция по умолчанию
Создать новую

A stock market graph on a black background.
Коллекция по умолчанию
Коллекция по умолчанию
Создать новую
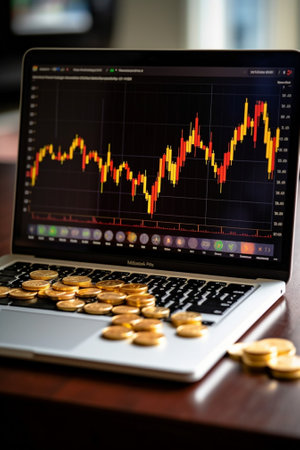
Close-Up View of Cryptocurrency Coins on Laptop Keyboard. The graph evolution of Bitcoin smartphone display. High quality photo
Коллекция по умолчанию
Коллекция по умолчанию
Создать новую
Bitcoin cryptocurrency gold coin. Trading on the cryptocurrency exchange. Trends in bitcoin exchange rates.
Коллекция по умолчанию
Коллекция по умолчанию
Создать новую
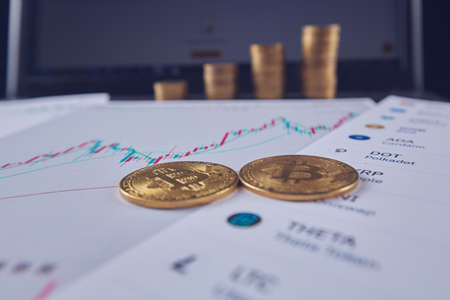
Two bitcoins are on the graphs of cryptocurrency rate changes on a laptop. In the background, several rows of coins and a laptop screen.
Коллекция по умолчанию
Коллекция по умолчанию
Создать новую
Grow Stock market trading graph in graphic concept.financial investment or economic trends business design. Abstract finance background.Low angle shot.
Коллекция по умолчанию
Коллекция по умолчанию
Создать новую
Bar graphs, Diagrams, financial figures. Forex chart. Abstract glowing forex chart interface wallpaper. Investment, trade, stock, finance and analysis concept.
Коллекция по умолчанию
Коллекция по умолчанию
Создать новую

Stock graph on computer on black background.
Коллекция по умолчанию
Коллекция по умолчанию
Создать новую
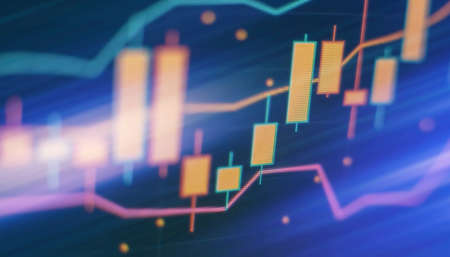
Chart of stock market investment trading, Bullish point, Bearish point. trend of graph design.
Коллекция по умолчанию
Коллекция по умолчанию
Создать новую
Stock market or forex trading graph and candlestick chart suitable for financial investment concept.
Коллекция по умолчанию
Коллекция по умолчанию
Создать новую
Golden bitcoin on laptop keyboard
Коллекция по умолчанию
Коллекция по умолчанию
Создать новую

A close-up view presents a digital display of financial data, featuring colorful line graphs and bar charts. The scene showcases a dark background with bright, contrasting colors, suggesting a modern interface. The image is suitable for illustrating concepts of business, finance, and investment. It could be used in various commercial applications.
Коллекция по умолчанию
Коллекция по умолчанию
Создать новую
Technical price graph and indicator, red and green candlestick chart on blue theme screen, market volatility, up and down trend. Stock trading, crypto currency background.
Коллекция по умолчанию
Коллекция по умолчанию
Создать новую
Stock market or forex trading graph and candlestick chart suitable for financial investment concept. Economy trends background for business idea and all art work design. Abstract finance background.
Коллекция по умолчанию
Коллекция по умолчанию
Создать новую
Legion-Media
Создайте свои проекты на основе качественных стоковых фотографий и видео.


Copyright © Legion-Media.